Decision Tree Visualization
This page contains a guide the many options for visualizing tree learners.
Interactive Visualizations
Tree Visualization
The write_html function allows you to construct an interactive browser visualization of a tree learner:
IAI.write_html("tree.html", lnr)In a Jupyter notebook, tree learners are automatically visualized in this way. If you are working from a terminal, you can open a browser window with a visualization of any tree learner using show_in_browser.
You can include the data in the interactive visualization using the data keyword argument:
IAI.write_html("tree_with_data.html", lnr, data=(X, y))The dataset is displayed in a table above the tree visualization, with additional columns containing predictions made by the tree model. The table has the following functionality:
- the rows can be sorted and filtered using the column headers
- the columns can be resized and rearranged
- clicking on a row in the table will highlight the path this point takes through the tree
- clicking a leaf in the tree will filter the data to show the points contained in this leaf
Questionnaires
The write_questionnaire function allows you to create an interactive questionnaire from a tree learner.
IAI.write_questionnaire("questions.html", lnr)You can open a browser window with the questionnaire for any tree learner using show_questionnaire.
These functions accept the keyword argument include_not_sure_buttons to control whether a "Not sure" response is offered for each question (the default behavior is to show these buttons if the training data had any missing values).
IAI.write_questionnaire("questions.html", lnr, include_not_sure_buttons=true)If a user selects the "Not sure" response when completing the questionnaire, it is handled as follows:
- if this is the only feature used at a split in the tree, its value will be treated as
missingand the split rule for missing data will be used for selecting the next question (note that if the original learner was trained without specifyingmissingdatamode, then the fallback behavior is for missing values to always follow the upper branch) - if this feature is used together with other features (e.g. in a hyperplane split or linear regression function), its value will be imputed using the mean value for this feature in the original training data
Multi-learner Interactive Visualizations
It is possible to combine many learners into a single interactive visualization that will present the user with the ability to change between the trees. We combine the learners as follows:
- a question is a
Pairof the formquestion => responseswherequestionis the string prompt for the question andresponsesis a vector of possible responses - each response is also a
Pairof the formanswer => nextwhereansweris the string answer for this option, andnextindicates how to proceed if this response is selected. The possible options fornextare:- another question to continue presenting options
- a tree learner to visualize
The following example prepares a series of questions to choose between a group of learners:
questions = ("Use tree" => [
    "with hyperplanes" => lnr_hyper,
    "without hyperplanes" => ("and maximum depth" => [
        "1" => lnr_nohyper_depth1,
        "2" => lnr_nohyper_depth2,
    ]),
])
We pass this to MultiTreePlot or MultiQuestionnaire to construct the visualization, which can then be saved to file with write_html or opened in the browser with show_in_browser as desired:
IAI.MultiTreePlot(questions)Visualizing Grid Search Results
You can visualize a grid search using MultiTreePlot, show_in_browser, and write_html to display the best fitted tree learner from the search, as well as tree learners under each parameter combination in a multi-learner visualization style:
using CSV, DataFrames
df = CSV.read("iris.csv", DataFrame)
X = df[:, 1:4]
y = df[:, 5]
grid = IAI.GridSearch(
    IAI.OptimalTreeClassifier(random_seed=1),
    max_depth=2:5,
)
IAI.fit!(grid, X, y)In a Jupyter notebook, the grid search will automatically be visualized in this way.
Similarly, you can construct an interactive questionnaire based on the grid search results using MultiQuestionnaire, show_questionnaire, and write_questionnaire.
Static Images
The write_png, write_pdf, and write_svg functions allow you to visualize a tree learner as an image in the respective format:
using Graphviz_jll
IAI.write_png("tree.png", lnr)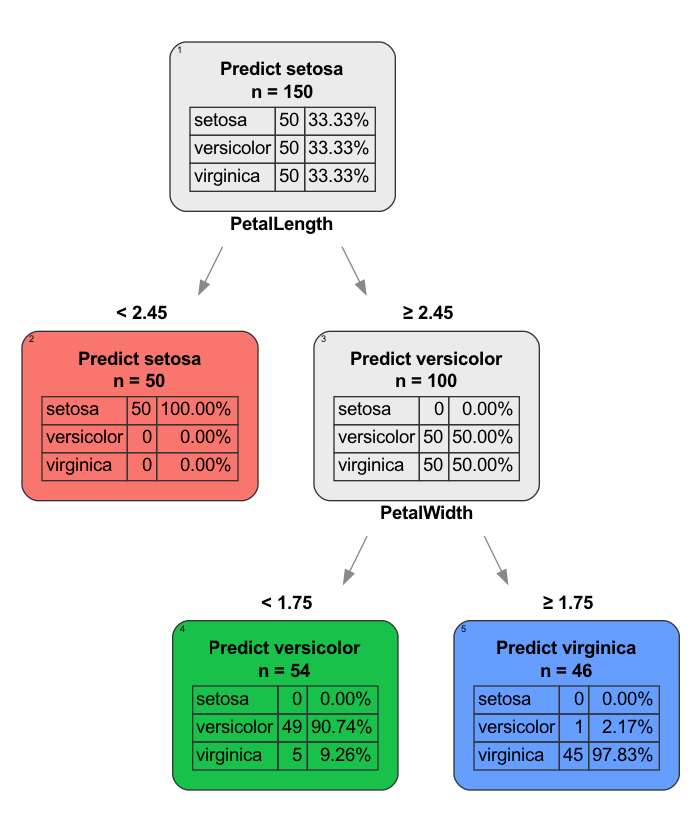
In order to use these functions, you must have a functional installation of GraphViz. There are two options:
- recommended: load the
Graphviz_jllpackage in Julia withusingorimport(shown above) - install Graphviz manually and ensure it is on the system
PATH.
As an alternative, you can also use write_dot to export the tree in .dot format and use GraphViz to render it as an image at a later time.
Miscellaneous
Missing values
When displaying the tree in the terminal or as an image, if the observations with missing observations goes to the lower child, the split message will say is missing in addition to the split criterion. Otherwise, no explicit message is displayed regarding the missing data direction.
Fitted OptimalTreeClassifier:
  1) Split: PqaqkCGc < 40
    2) Split: UJS68cRl ≤ 3 or is missing
      3) Predict: 1 (86.87%), [13,86], 99 points, error 0.1313
      4) Predict: 0 (100.00%), [33,0], 33 points, error 0
    5) Split: hKUNQhuZ is missing
      6) Predict: 1 (98.75%), [1,79], 80 points, error 0.0125
      7) Predict: 0 (92.36%), [266,22], 288 points, error 0.07639
In the interactive tree visualization, the child node that receives data with missing values is denoted by a small dot on top of the node.
You can remove these missing-direction indicators by setting the show_missing_direction keyword argument to false.
Specifying the display label
By default, classification tree learners show the probability of the predicted label in each leaf:
In the example above, we see that one leaf predicts A with 55% probability and the other predicts B with 85% probability. To make it easier to compare these probabilities at a glance, it might be preferable to show the probability of predicting the same label in every leaf, e.g., showing the probability of predicting A in each leaf.
Using set_display_label! it is possible to configure the visualization to show the probability for a specified label in each leaf. In this case, probability of label A is displayed in all leaves:
IAI.set_display_label!(lnr, "A")The original behavior can be restored using reset_display_label!.
Rich output in terminal
When using iTerm2 with shell integration, it is possible for trees to be displayed graphically in the REPL rather than as plain text. This feature requires that you have TerminalExtensions.jl installed and graphviz available on the system path. After installing TerminalExtensions, make sure to follow the setup instructions in the README.
On macOS, you can install graphviz with brew install graphviz --with-pango.