Racial Bias in Jury Selection
This example presents the fully-worked analysis in our published work that uses interpretable methods to investigate the presence of human biases in decision making. In particular, we consider the role of race in jury selection. In 1986, the U.S. Supreme Court ruled that using race as a reason to remove potential jurors is unconsititutional. Despite this ruling, a large disparity in juror strike rates across races appears to remain.
This disparity was the focus of the 2019 U.S. Supreme Court case "Flowers v. Mississippi", where it was ruled that the District Attorney Doug Evans from the Fifth Circuit Court District in Mississippi had discriminated based on race during jury selection in the six trials of Curtis Flowers.
To support the case, APM Reports collected and published court records of jury strikes in the Fifth Circuit Court District and conducted analysis to assess if there was a systematic racial bias in jury selection in this district. The data included information on each trial, juror, and the voir dire answers by the jurors between 1992 and 2017. As part of their analyses, they used a logistic regression model and concluded that there was significant racial disparity in jury strike rates by the State, even after accounting for other factors in the dataset.
We will use our methods to investigate:
- Whether we reach the same conclusion that there is significant racial disparity in strike rates
- Whether the racial disparity is the same across the board, or there are specific subgroups where the disparity is most prominent.
Data Preparation
We follow the same data preparation as the methodology in the report to ensure consistency. First, we prepare the data so that each row corresponds to a juror at a particular trial:
using CSV, DataFrames

jurors = CSV.read("jury-data-master/jurors.csv", DataFrame)
trials = CSV.read("jury-data-master/trials.csv", DataFrame)
answers = CSV.read("jury-data-master/voir_dire_answers.csv", DataFrame)
select!(answers, Not([:id, :notes]))

data = leftjoin(jurors, trials, on=(:trial__id => :id))
data = innerjoin(data, answers, matchmissing=:equal,
                 on=[(:id => :juror_id), (:trial__id => :juror_id__trial__id)])
3545×112 DataFrame
Row │ id trial trial__id race gender r ⋯
│ Int64 String Int64 String String S ⋯
──────┼─────────────────────────────────────────────────────────────────────────
1 │ 107 2004-0257--Sparky Watson 3 White Male J ⋯
2 │ 108 2004-0257--Sparky Watson 3 Black Female J
3 │ 109 2004-0257--Sparky Watson 3 Black Female J
4 │ 110 2004-0257--Sparky Watson 3 Black Female J
5 │ 111 2004-0257--Sparky Watson 3 White Male J ⋯
6 │ 112 2004-0257--Sparky Watson 3 Black Female J
7 │ 113 2004-0257--Sparky Watson 3 Black Male J
8 │ 114 2004-0257--Sparky Watson 3 White Male J
⋮ │ ⋮ ⋮ ⋮ ⋮ ⋮ ⋱
3539 │ 262 1994-9942--Suzanne Ilene Tavares 6 White Female J ⋯
3540 │ 1094 2002-0067--Deondray Johnson 22 White Female J
3541 │ 3478 2010-0012--Jerome Patterson 70 White Female J
3542 │ 3485 2010-0012--Jerome Patterson 70 White Female J
3543 │ 3487 2010-0012--Jerome Patterson 70 Black Female J ⋯
3544 │ 2980 1995-2258--Robert Bingham 60 Black Female J
3545 │ 2386 2001-0003--Lawrence Branch 47 White Male J
107 columns and 3530 rows omittedWe are interested in understanding what leads to a juror being struck by the State. For this purpose, we subset to only jurors eligible to be struck by the State.
data = data[(data.strike_eligibility .== "State") .+
            (data.strike_eligibility .== "Both State and Defense") .> 0, :]
Next, we assemble the features, which include the juror's gender, race, and the defendant's race. In addition, we have the voir dire answers to 65 questions.
data.is_black = data.race .== "Black"
data.same_race = data.race .== data.defendant_race

categorical_vars = [["is_black", "gender", "defendant_race", "same_race"];
                    names(answers, Not(["juror_id", "juror_id__trial__id"]))]

using CategoricalArrays
X = select(data, categorical_vars .=> categorical, renamecols=false)
The target is whether the juror was struck by the State:
y = [v == "Struck by the state" ? "Strike" : "No strike"
     for v in data.struck_by]
Finally, we can split into training and testing:
seed = 1
(X_train, y_train), (X_test, y_test) = IAI.split_data(:classification, X, y,
                                                      seed=seed)
Optimal Feature Selection
The first model we apply is Optimal Feature Selection. This is similar to the backward stepwise logistic regression model used in the original study, except that instead of iteratively selecting and removing variables that are insignificant, the Optimal Feature Selection will pick the optimal set of variables in a single step.
We run the Optimal Feature Selection, considering all possible combinations of up to 15 features, and selecting the best combination based on the AUC on a hold-out validation set:
ofs_grid = IAI.GridSearch(
    IAI.OptimalFeatureSelectionClassifier(
      random_seed=seed,
    ),
    sparsity=1:15,
)
IAI.fit_cv!(ofs_grid, X_train, y_train, validation_criterion=:auc)
IAI.get_learner(ofs_grid)
Fitted OptimalFeatureSelectionClassifier:
Constant: -1.99072
Weights:
accused=true: 2.54637
death_hesitation=true: 1.86823
defendant_race=Unknown: 0.589933
fam_accused=true: 1.47964
fam_crime_victim=true: 0.534126
fam_law_enforcement=true: -0.365057
is_black=true: 1.41219
know_def=true: 1.273
law_enforcement=true: -0.686454
leans_defense=true: 1.76438
married=married: -0.605019
medical=true: 2.2713
no_death=true: 4.29094
same_race=true: 0.374411
(Higher score indicates stronger prediction for class `Strike`)We see that is_black is among the 14 features selected in the best model, in addition to other variables such as know_def (juror has prior familiarity with defendant through either personal or professional channels) and fam_accused (the juror has friends or family accused of being involved in criminal activity). This reaffirms the finding of the previous analysis that is_black is a useful feature in the logistic regression model for predicting the probability of strike.
IAI.score(ofs_grid, X_test, y_test, criterion=:auc)0.8253396158517383The model also has strong predictive performance, with an out-of-sample AUC of 0.826.
To augment these findings, we can visualize the variable importance across all sparsity levels. The importance is normalized so the most important variable has a value of 1 at each sparsity. The variables are incrementally included from the bottom as they become selected under higher sparsity.
using Plots
plot(ofs_grid, type=:importance, size=(600, 600))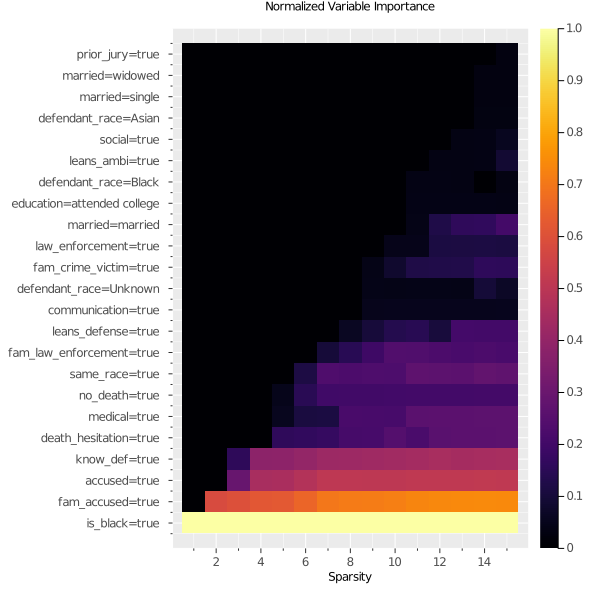
We can see that is_black is evaluated as the most important variable for every level of sparsity, which demonstrates that it has roughly the same predictive power regardless of what other features are added. This gives evidence that it is capturing signal not present in the other variables.
To further confirm that the race of the juror being black is important in explaining the strike decision, we can build a model without the race variables and compare the performance:
ofs_grid_no_race = IAI.GridSearch(
    IAI.OptimalFeatureSelectionClassifier(
      random_seed=seed,
    ),
    sparsity=1:15,
)
IAI.fit_cv!(ofs_grid_no_race, select(X_train, Not([:is_black, :same_race])),
            y_train, validation_criterion=:auc)

IAI.score(ofs_grid_no_race, X_test, y_test, criterion=:auc)0.6900949125095581We see that AUC falls by around 12% when we remove race from the model, a very strong indication that the race being black is highly explanatory to being struck, and that we cannot proxy this signal using other features in the dataset.
As a small side note, if the two models had similar performance this would not be sufficient evidence to conclude that race has no impact on the decision, as in that case other variables in the dataset may still be proxying for the race. However, in our case the large decrease in performance that we see upon removing race is strong evidence that race has unique predictive power in explaining the outcome that cannot be proxied with other variables.
Identifying Subgroups with Disparity
We have strong evidence that the race of the juror plays a strong role in predicting the probability of being struck by the State. Next, we would like to investigate if there are specific subpopulations where this effect is more or less pronounced. To do this, we will move away from linear models and use Optimal Classification Trees as a tool to identify subpopulations with statistically significant differences in strike rate based on race.
To do this, we first train an Optimal Classification Tree without the race variable:
grid = IAI.GridSearch(
    IAI.OptimalTreeClassifier(
        criterion=:gini,
        random_seed=seed,
        missingdatamode=:separate_class,
        split_features=Not([:is_black, :same_race]),
    ),
    max_depth=2:5,
)
IAI.fit!(grid, X_train, y_train, validation_criterion=:auc)
lnr = IAI.get_learner(grid)
IAI.set_display_label!(lnr, "Strike")The resulting tree has identified seven subgroups of jurors that have similar probabilities of being struck by the State. Importantly, these subgroups are defined without considering the race of the juror. For example, node 2 contains jurors that have been accused of a crime in the past, who understandably have a very high strike rate of 93%.
Next, we test if there is a significant difference in strike rate between black and non-black jurors in each subgroup using Fisher's Exact Test.
group = [x == true ? "Black" : "Non-black" for x in X.is_black]
outputs = IAI.compare_group_outcomes(lnr, X, y, group, positive_label="Strike")
pvalues = [o.p_value["vs-rest"]["Black"] for o in outputs]
Because we are simultaneously conducting several hypothesis tests, we use the Holm-Bonferroni method to adjust the p-values to avoid false positives.
using MultipleTesting
pvalues = adjust(pvalues, Holm())
We display the strike rate for each group in the node, and the p-value from the test. If a node shows a statistically significant difference between the two groups, it is colored red or green depending on the sign of the difference.
extras = map(1:length(outputs)) do i
  summary = outputs[i].summary
  p_value = pvalues[i]
  node_color = if p_value > 0.05
    "#FFFFFF"
  elseif summary.prob[1] > summary.prob[2]
    "#FFADB4"
  else
    "#92D86F"
  end

  node_summary = "Strike rate for Black: $(round(Int, summary.prob[1] * 100))%; " *
                 "For non-Black: $(round(Int, summary.prob[2] * 100))% " *
                 "(p=$(round(p_value, digits=3)))"

  node_details = IAI.make_html_table(summary)

  Dict(:node_summary_include_default => false,
       :node_details_include_default => false,
       :node_summary_extra => node_summary,
       :node_details_extra => node_details,
       :node_color => node_color)
end
IAI.TreePlot(lnr, extra_content=extras)There are two cohorts where there is no statistically significant difference in strike rate between black and non-black jurors:
- Node 2: potential jurors that have been accused of a crime
- Node 12: potential jurors with reservations about the death penalty
However, there is statistically significant distinction in strike rate between black and non-black potential jurors in nodes 5, 6, 9, 10 and 13. For example, Node 5 contains those who have never been accused of a crime, but know the defendant and have family in law enforcement. If a person in this group is black, the strike rate is 73% compared to 0% if this person were white. It appears that this reason for striking jurors is disproportionally applied to black jurors, as none of the 18 non-black jurors meeting these criteria were struck.
Overall, the Optimal Classification Tree finds four major lines of reasoning that are used to exclude jurors from the pool. Of the six resulting groups likely to be struck, the strikes in two of the groups (nodes 2 and 12) are applied regardless of race, but in the others (nodes 5, 6, 9 and 10) the strikes are applied to black jurors significantly more than non-black jurors, which is strongly suggestive of racial biases factoring into the strike decisions of the State.
Conclusions
The original study used a backward stepwise logistic regression to conclude that there is significant racial disparity in juror strike outcome. This method is only an approximation to variable selection and has the potential to lead to a misleading characterization of variables as important or not.
With Optimal Feature Selection, we still find that race is consistently selected as the most predictive variable of juror strike outcome at all levels of sparsity. This strengthens the conclusion in the original study, as we knowing that the variable selection is exact. Furthermore, we observe a significant decrease in model performance when the race variable is removed, indicating this feature is providing unique signal in the data.
In addition, we used Optimal Classification Trees to systematically identify subgroups of the population with similar chances of being struck, and found that in five of these groups there was a significant disparity in strike rate between black and non-black jurors. These subgroups suggest systemic patterns of racial bias in the strike process, and provide direct characterizations of the situations in which black jurors are likely to have experienced discrimination.