Optimal Feature Selection Visualization
This page contains a guide for visualizing Optimal Feature Selection learners.
Plotting Grid Search Results
When sparsity is the only parameter in the grid search, it is possible to automatically visualize the results of the search. After loading Plots.jl, you can call plot on the GridSearch object. The plot function supports two values for the type parameter.
Validation Score Against Sparsity
:validation shows the validation score against sparsity as a line plot:
using Plots
plot(grid, type=:validation)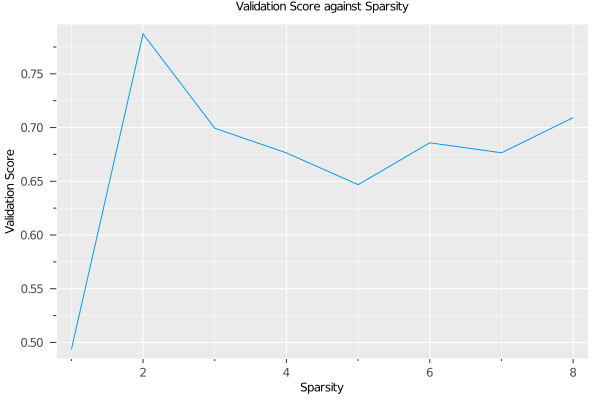
This plot is particularly useful in selecting the sparsity level. Even though the grid search returns the optimal sparsity level, the validation scores can be close for many of the parameters. As a result, it is important to explore the tradeoff between the complexity of the model and the quality of predictions, which is what this plot shows.
Variable Importance Heatmap
:importance shows the variable importance at various levels of sparsity as a heatmap. The importance is normalized so the most important variable has a value of 1 at each sparsity. The variables are incrementally included from the bottom as they become selected under higher sparsity.
plot(grid, type=:importance)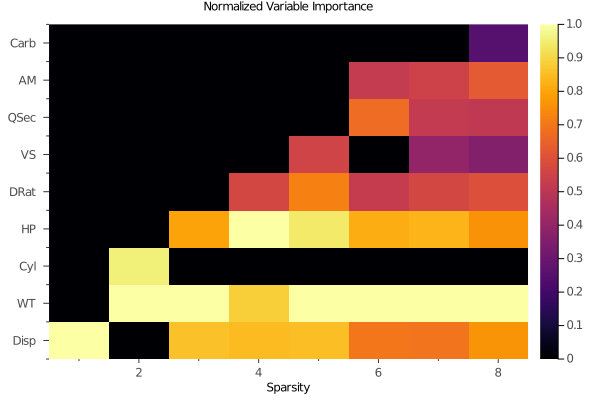
We see that Disp is the first variable to be selected at sparsity of 1. However, as we increase the sparsity, WT followed by HP becomes consistently selected with high importance, indicating potentially more consistent and higher importance of WT and HP than Disp.
Combining Multiple Plots
You can also combine these plots by combining the type inputs. For example, you can plot them side by side (this is the default if type is not specified):
plot(grid, type=[:importance :validation])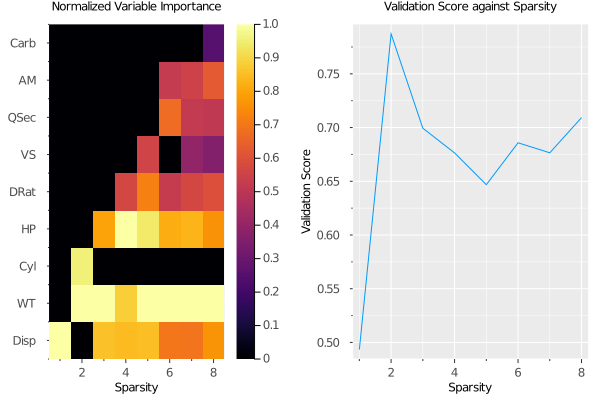
Or vertically:
plot(grid, type=[:validation; :importance])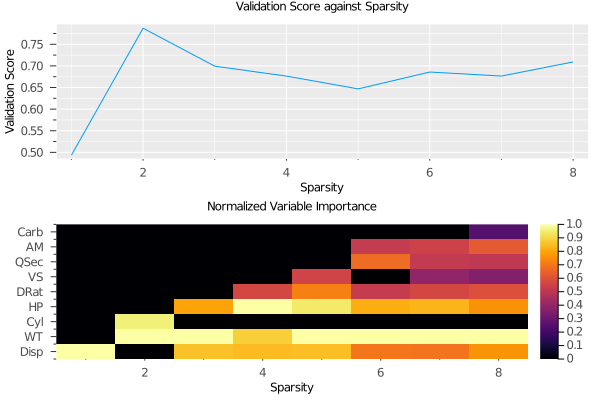
Questionnaires
The write_questionnaire function allows you to create an interactive questionnaire from an Optimal Feature Selection learner.
lnr = IAI.get_learner(grid)
IAI.write_questionnaire("questions.html", lnr)
You can open a browser window with the questionnaire for any Optimal Feature Selection learner using show_questionnaire.
You can also make multi-learner interactive visualizations or visualize grid search results. For example, to show all the Optimal Feature Selection learners searched in a grid search as a single questionnaire, you can do the following:
IAI.write_questionnaire("questions.html", grid)